WEIS Visualization APP
This application provides a web-based graphical user interface to visualize input/output from WEIS. For output visualization, the app can visualize the outputs of OpenFAST, a WEIS optimization including DLC statistics, and WISDEM (blade, cost). The application can also visualize the WEIS geometry (WindIO) input, including 3D Wind Turbines Geometries and component properties of the airfoils, blade, and tower.
All of the graphical objects has been generated via Plotly library, which is easy to interact, zoom, and download the plots.
Installation
We offer two types of installation: (1) for users who wants to leverage HPC and (2) for users working on their local machines. The HPC set up is in steps 1–3. Users on local machines can skip to step 4. From our preliminary study, the app was able to successfully visualize the example optimization case which has around 430GB of information included.
Get an interactive node
salloc --time=60:00 --account=weis --partition=debug
Go to preferred directory
cd WEIS-Demo
Install WEIS and dependencies
We created a bash script which installs all of the related libraries with a single command. We recommend downloading that file first and then running the script.
wget https://raw.githubusercontent.com/NLRWindSystems/WEIS/main/share/kestrel_install.sh -O kestrel_install.sh
bash kestrel_install.sh -p [conda_env_path] -raft -wisdem
# For example: bash kestrel_install.sh -p env/weis-env -raft -wisdem
Please check if the installation of weis, conda virtual environment, openfast, rosco, wisdem and raft are successful by running a few example cases.
The following steps (4 and 5) apply to running the visualization application from an HPC host or locally.
Generate visualization input yaml file
module load conda
conda activate env/weis-env
(.weis-env) $ cd weis/weis/visualization/appServer/share/
(.weis-env) $ python vizFileGen.py --modeling_options [path_to_modeling_options] --analysis_options [path_to_analysis_options] --wt_input [path_to_final_wind_io] --output vizInput.yaml
Note that you can use the modeling and analysis options generated within the output folder of the WEIS run. This output file will be generated by WEIS automatically in the near future.
Please make sure the file generation is successful. The file should include correct output directory structure.
OpenFAST output file paths can be added as you wish, either with absolute path or with the relative path from WEIS. An example is shown as below.
outputDirStructure:
   dirs:
      of_COBYLA:
         dirs:
         openfast_runs:
            dirs:
               Airfoils: ...
               iteration_0: ...
               iteration_1: ...
               iteration_2: ...
               wind:
userOptions:
   deisgn_of_experiments: false
   inverse_design: false
   optimization:
      status: true
      type: 3
   output_fileName: IEA-22-280-RWT
   output_folder: examples/17_IEA22_Optimization/17_IEA22_OptStudies/of_COBYLA
   sql_recorder: true
   sql_recorder_file: log_opt.sql
userPreferences:
   openfast:
      file_path:
         file1: examples/03_NREL5MW_OC3_spar/outputs/03_NREL5MW_OC3_spar/NREL5MW_OC3_spar_0.out
         file2: examples/06_IEA-15-240-RWT/outputs/06_IEA15_TMD_optimization/openfast_runs/DLC1.6_0_weis_job_0.out
         file3: examples/06_IEA-15-240-RWT/outputs/OpenFAST_DOE/openfast_runs/DLC1.6_0_weis_job_0.out
      graph:
         xaxis: Time
         yaxis:
         - Wind1VelX
         - GenPwr
         - BldPitch1
         - GenSpeed
         - PtfmPitch
   optimization:
      convergence:
         channels:
         - floating.jointdv_0
         - floating.jointdv_1
         - floating.memgrp1.outer_diameter_in
         - floatingse.system_structural_mass
      dlc:
         xaxis: Wind1VelX
         xaxis_stat: mean
         yaxis:
         - Wind1VelY
         - GenSpeed
         - PtfmPitch
         yaxis_stat: max
      timeseries:
         channels:
         - Wind1VelX
         - GenPwr
         - BldPitch1
         - GenSpeed
         - PtfmPitch
   wisdem:
      blade:
         shape_yaxis:
         - rotorse.rc.chord_m
         - rotorse.re.pitch_axis
         - rotorse.theta_deg
         struct_yaxis:
         - rotorse.rhoA_kg/m
         struct_yaxis_log:
         - rotorse.EA_N
         - rotorse.EIxx_N*m**2
         - rotorse.EIyy_N*m**2
         - rotorse.GJ_N*m**2
         xaxis: rotorse.rc.s
   output_path: examples/17_IEA22_Optimization/17_IEA22_OptStudies/of_COBYLA
yamlPath: weis/visualization/appServer/app/tests/testIEA22OF.yaml
The selected channels from the app should be saved between runs, which help users to resume their previous work.
Run the server
cd ../app
(.weis-env) $ python mainApp.py --input [path_to_viz_input] --host [host_number] --port [port_number]
Now, you are able to see the hosting url with defined port number where your app server is running.
Depending on your operating system, some valid host numbers (for the local host) are 0.0.0.0, 127.0.0.1, and 192.168.0.0.
If you are having issues seeing the host and port returned, try unset HOST.
Connect the app with local machine
After finishing the set up from the HPC, open a new terminal from your local machine and run:
ssh -L [port_number]:[host_name from \#1]:[port_number] kl1.hpc.nrel.gov
# For example, if you have not assigned specific port number to app: ssh -L 8050:[host_name from \#1]:8050 kl1.hpc.nrel.gov
Open a web browser, preferably Safari or Chrome, and go to the hosting url that shows from step #5.
WEIS Outputs
OpenFAST
Plot OpenFAST time series from a WEIS optimization output directory. The user can select the channels they wish to plot. The outputs are from the last optimization iteration.

Optimization
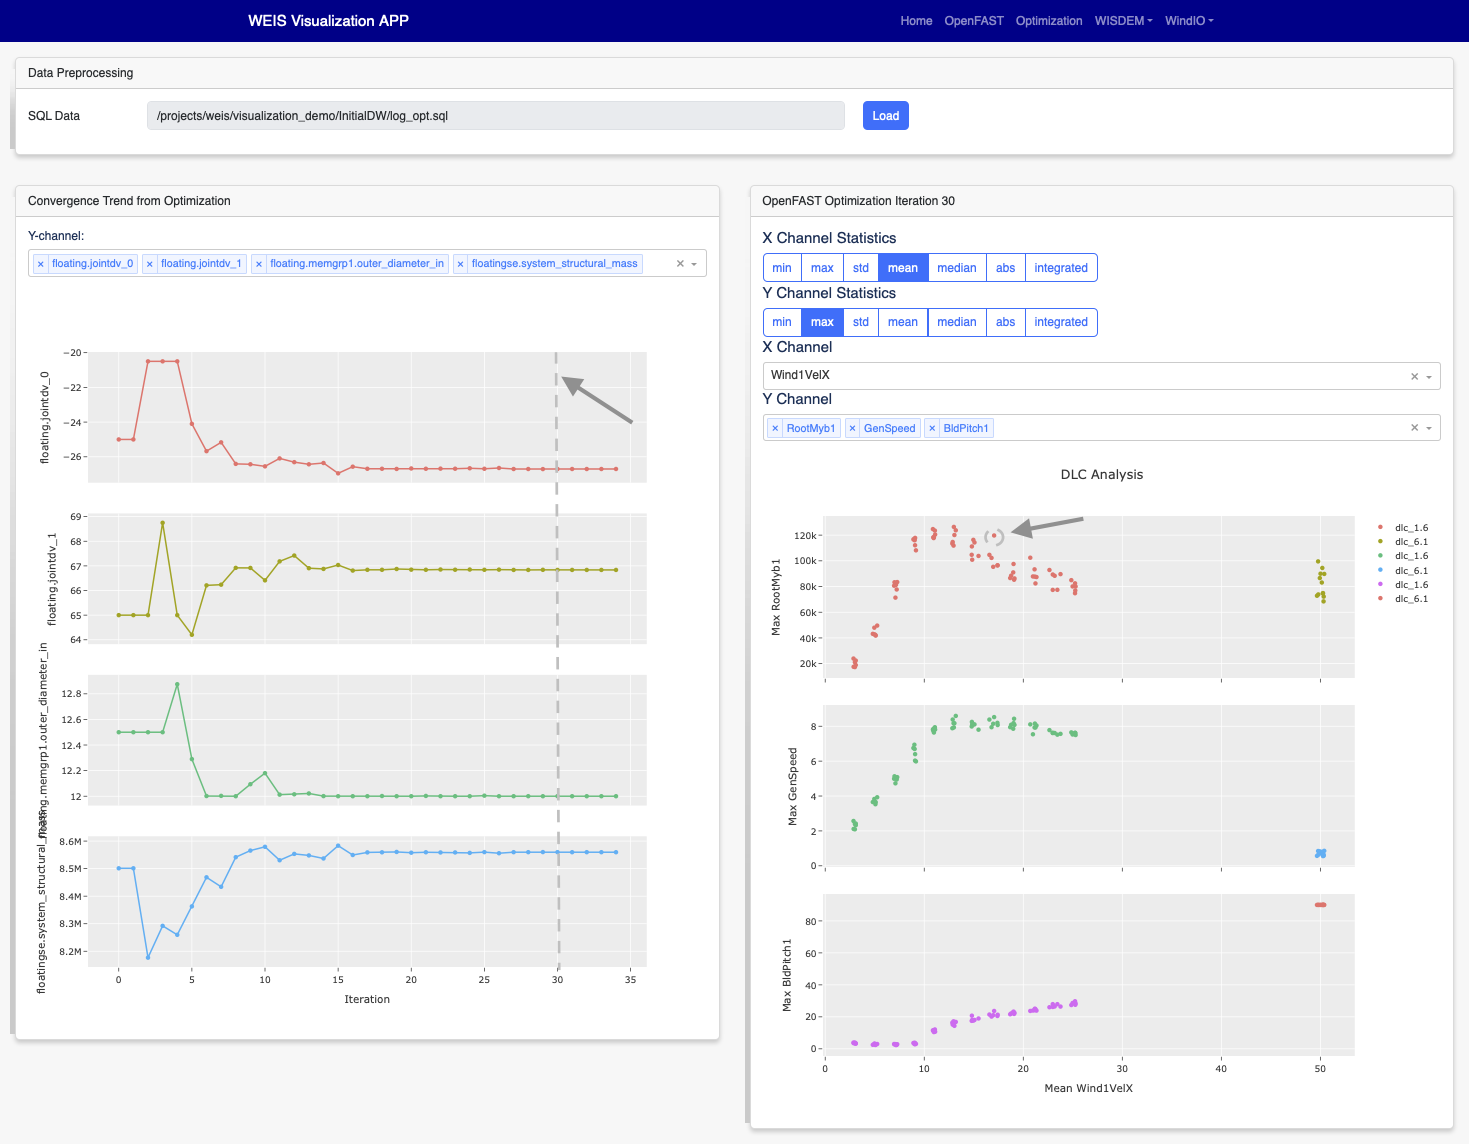
OpenFAST optimization
First, we need to check if the optimization type is correct. For OpenFAST Optimization, please check if status is true and type is 3 from the userOptions/optimization. Then, we read design constraints and variables from userPreferences/optimization.
Please make sure data is loaded first by pressing Load button.
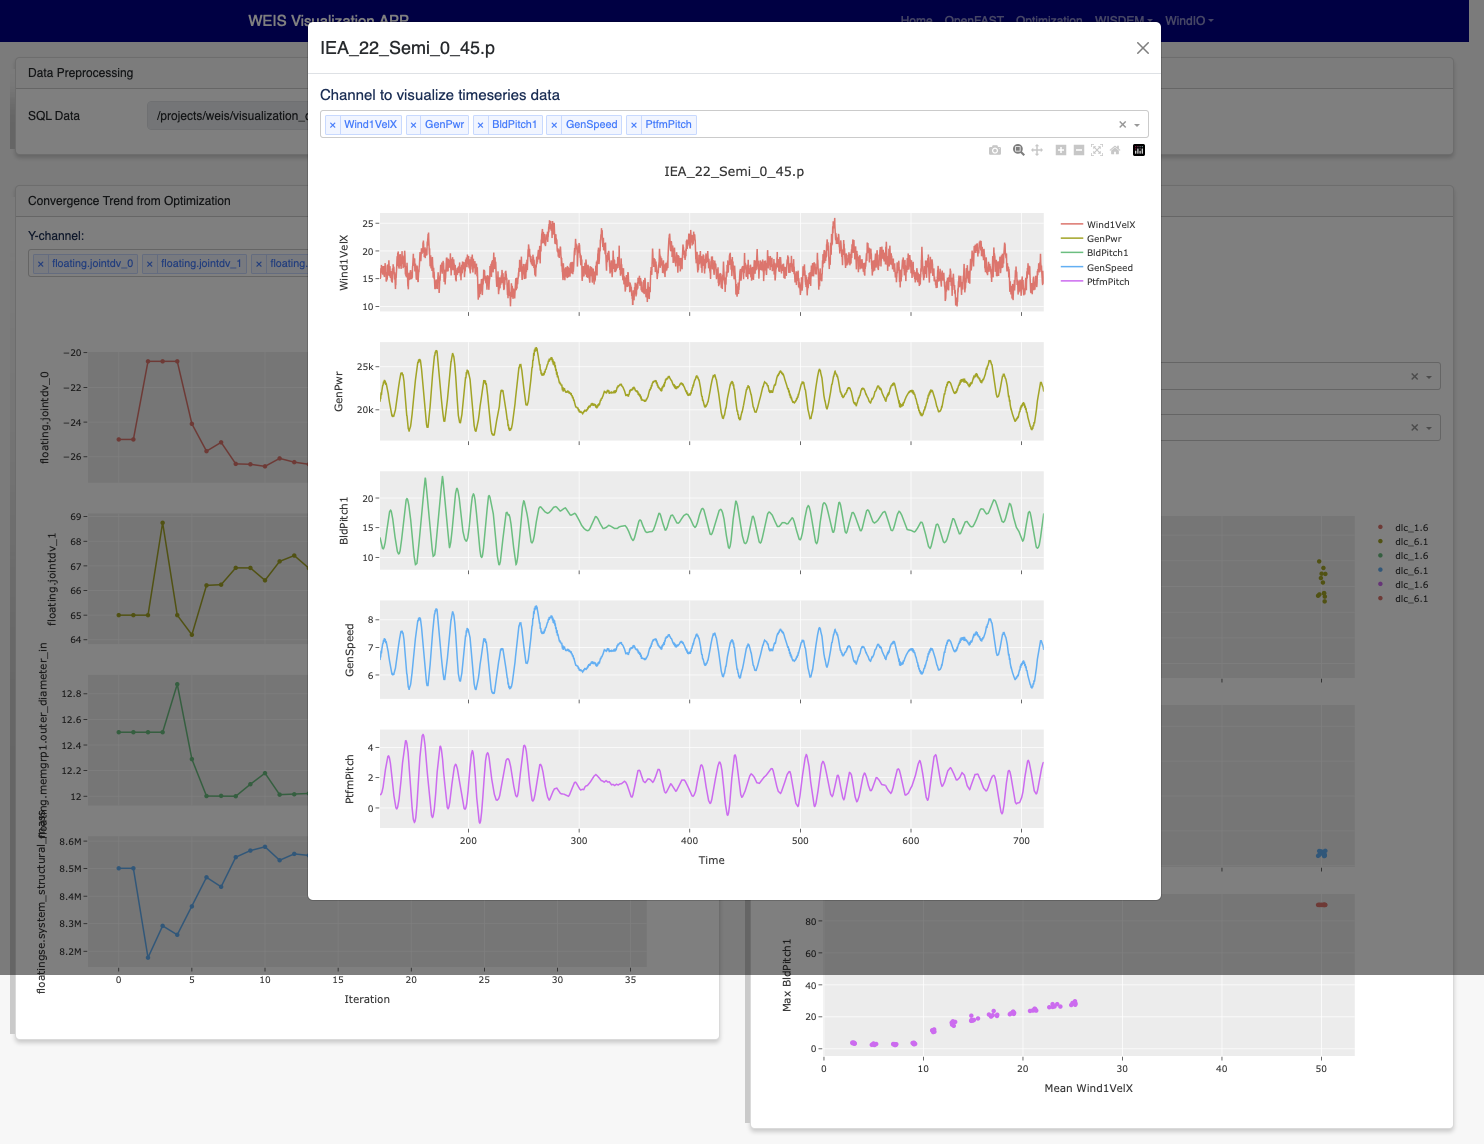
Optimization convergence trend data will be first shown on the left, from the log_opt.sql file. The user can click on a specific iteration, and the corresponding DLC statistics will be shown on the right. The specific OpenFAST time-series plots can be visualized as well via clicking specific data points.
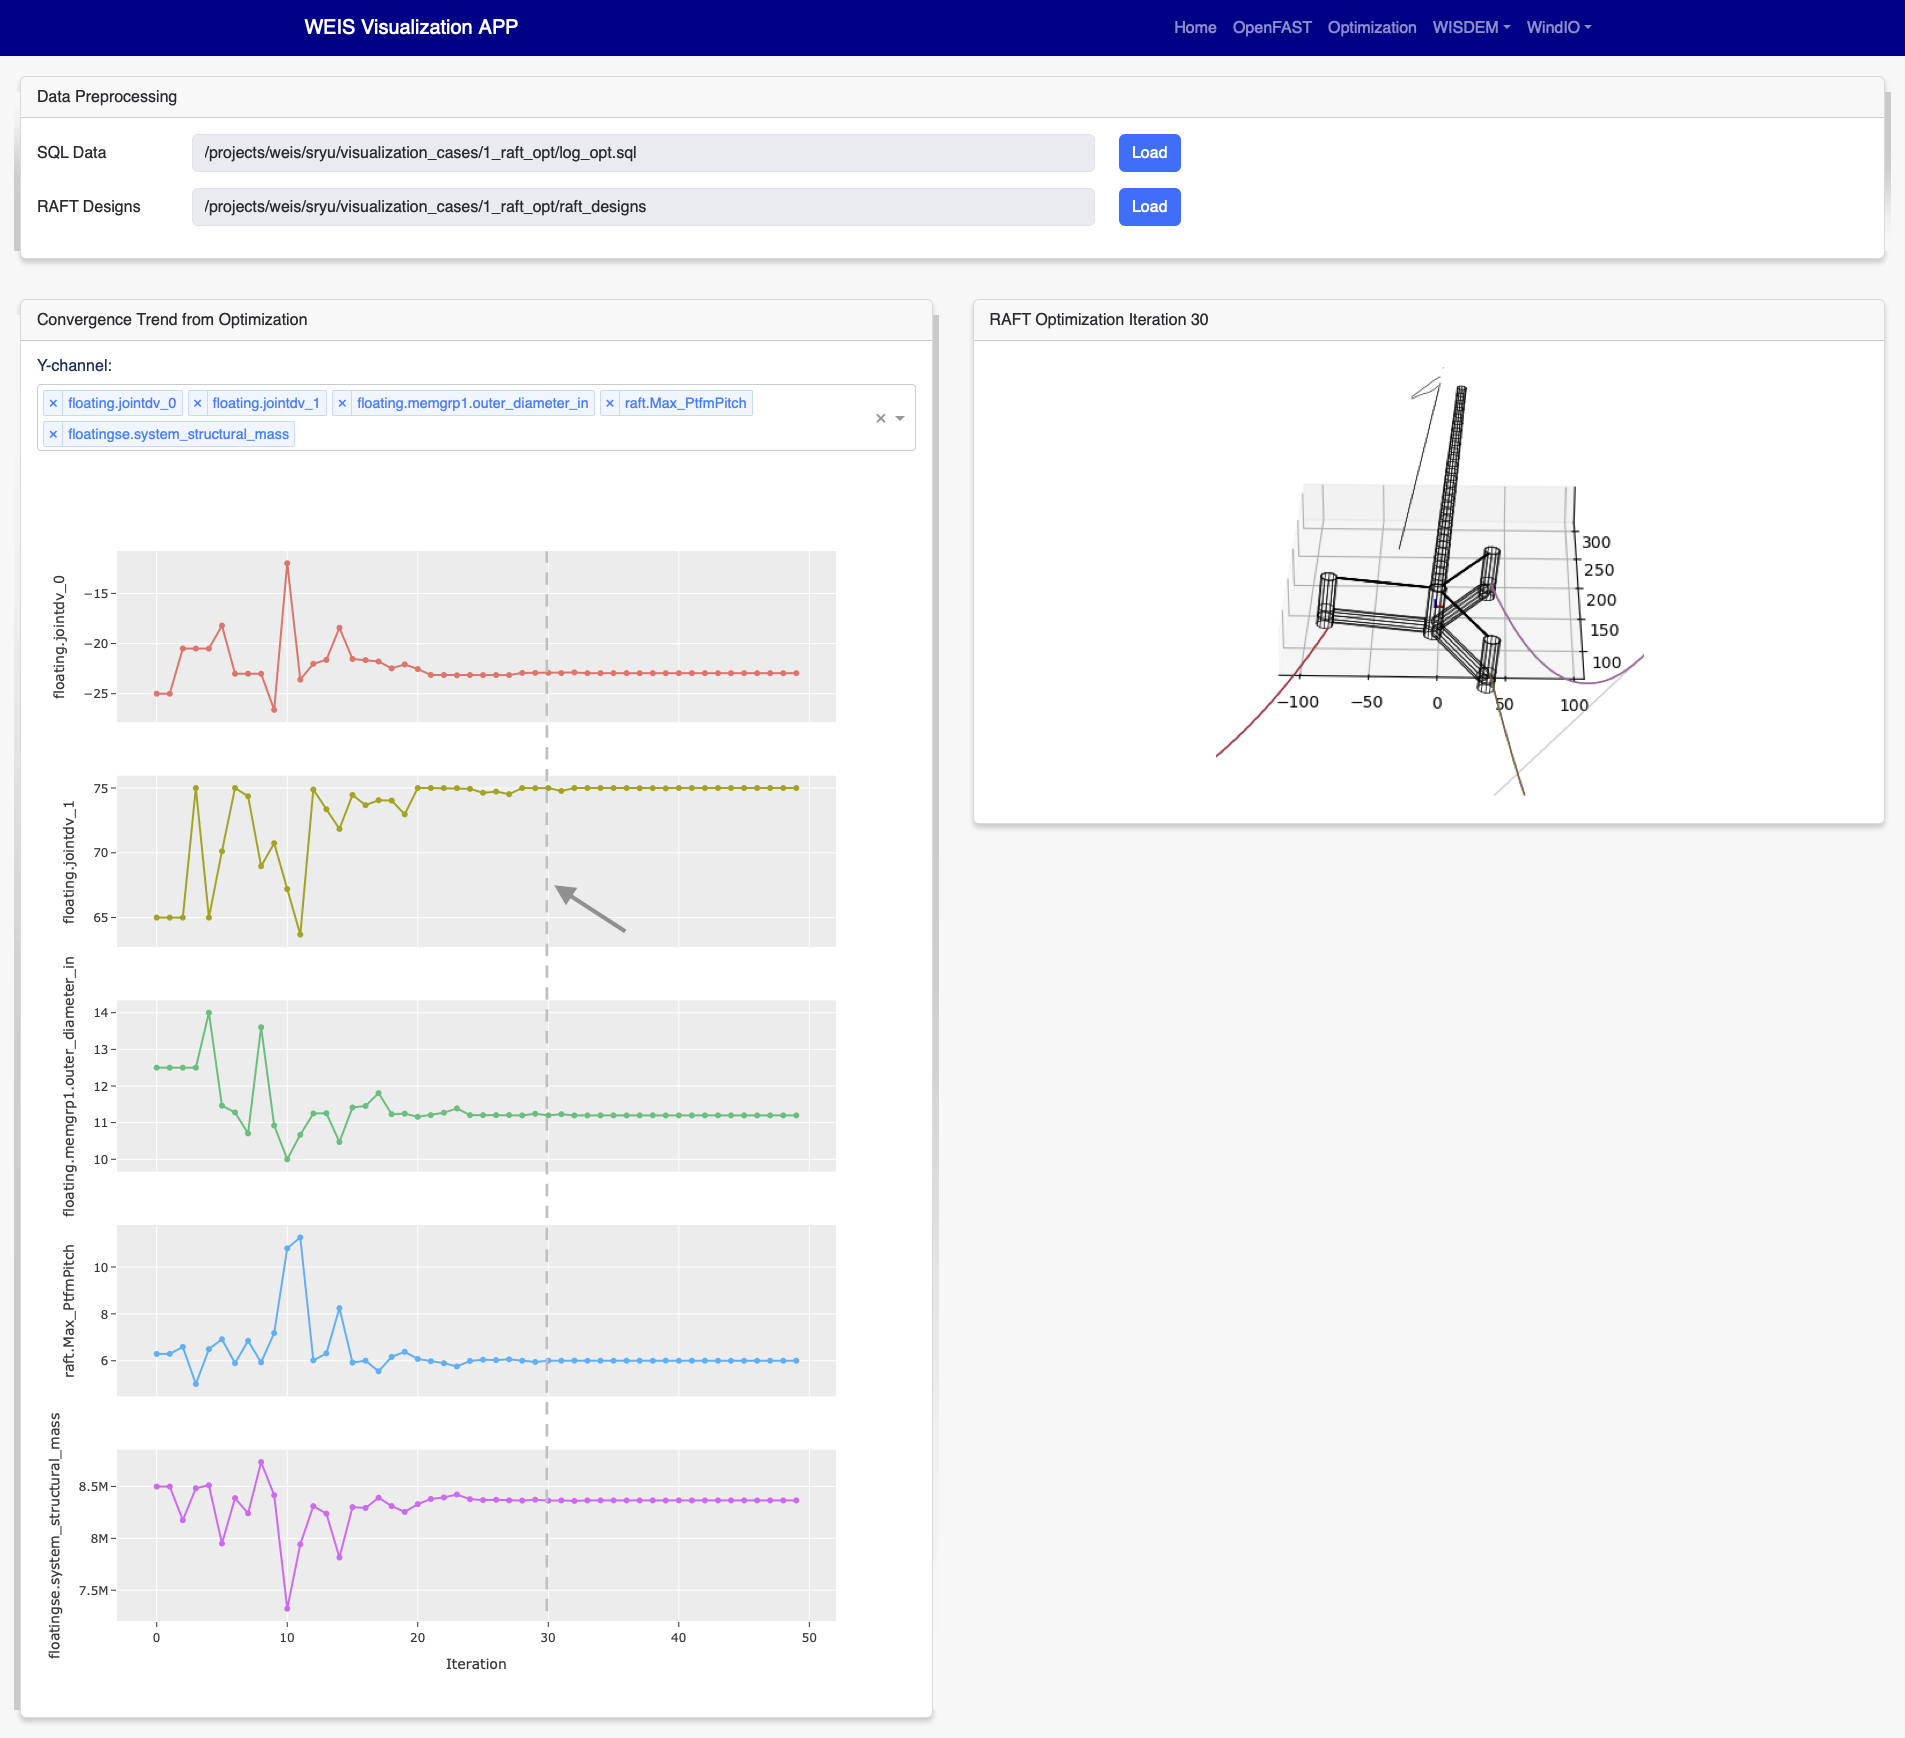
RAFT optimization
First, we need to check if the optimization type is correct. For RAFT Optimization, please check if status is true and type is 1 from the userOptions/optimization. Then, we read platform design variables from userPreferences/optimization/convergence/channels.
Please make sure data are loaded first by pressing Load button.
By selecting a specific iteration from the convergence graph, the corresponding 3D platform design plot will appear on the right.
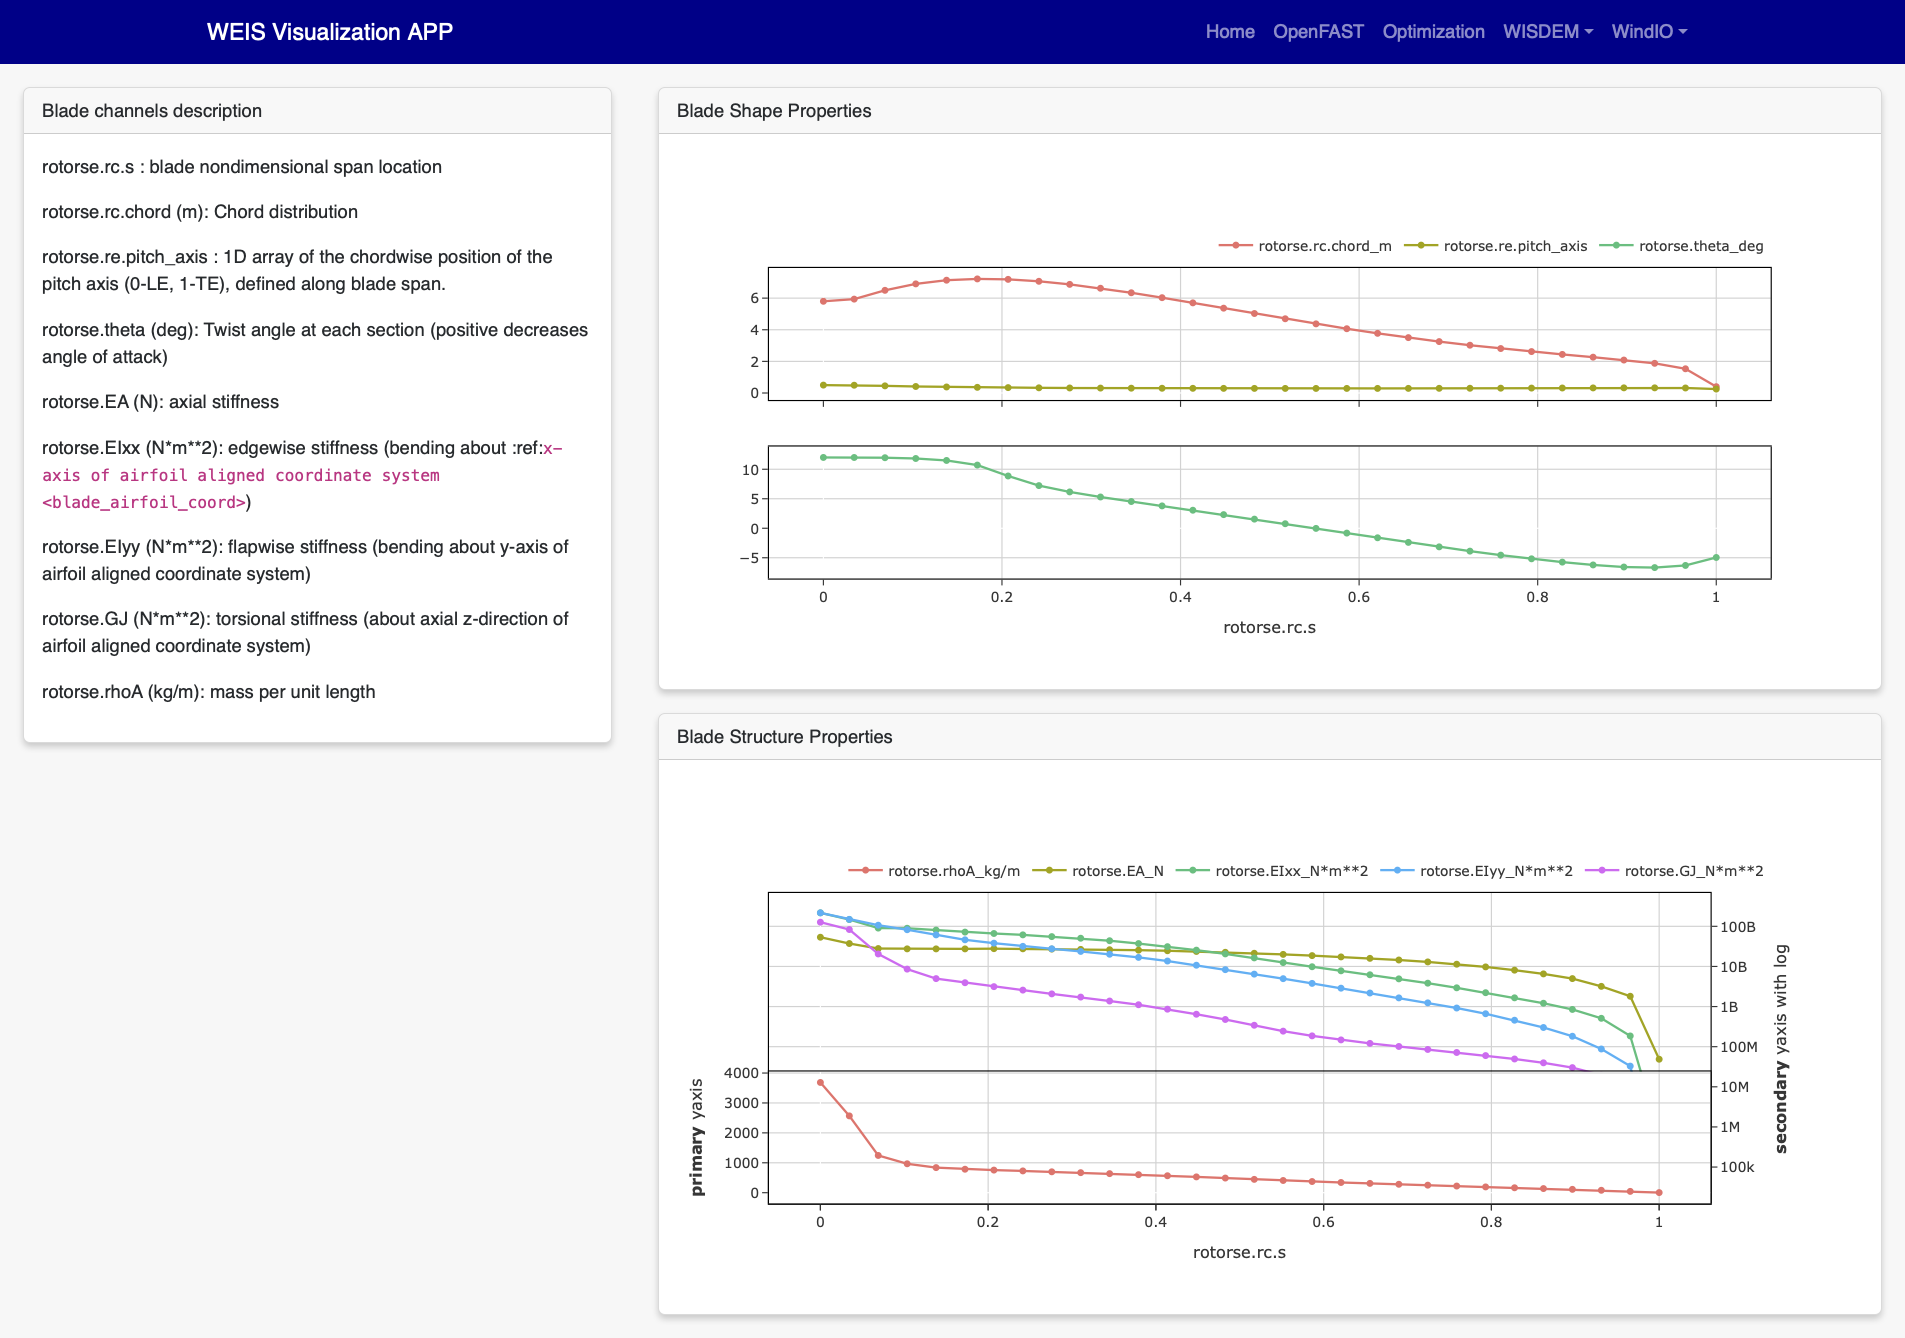
WISDEM - Blade
Read blade related properties from the openmdao output channels, and visualize the following information.
WISDEM - Cost
Cost-related variables are also an output of WISDEM and WEIS. The tool reads the openmdao outputs and visualizes the cost-breakdown. Note that cost calculation is based on NREL CSM model .

WEIS Inputs
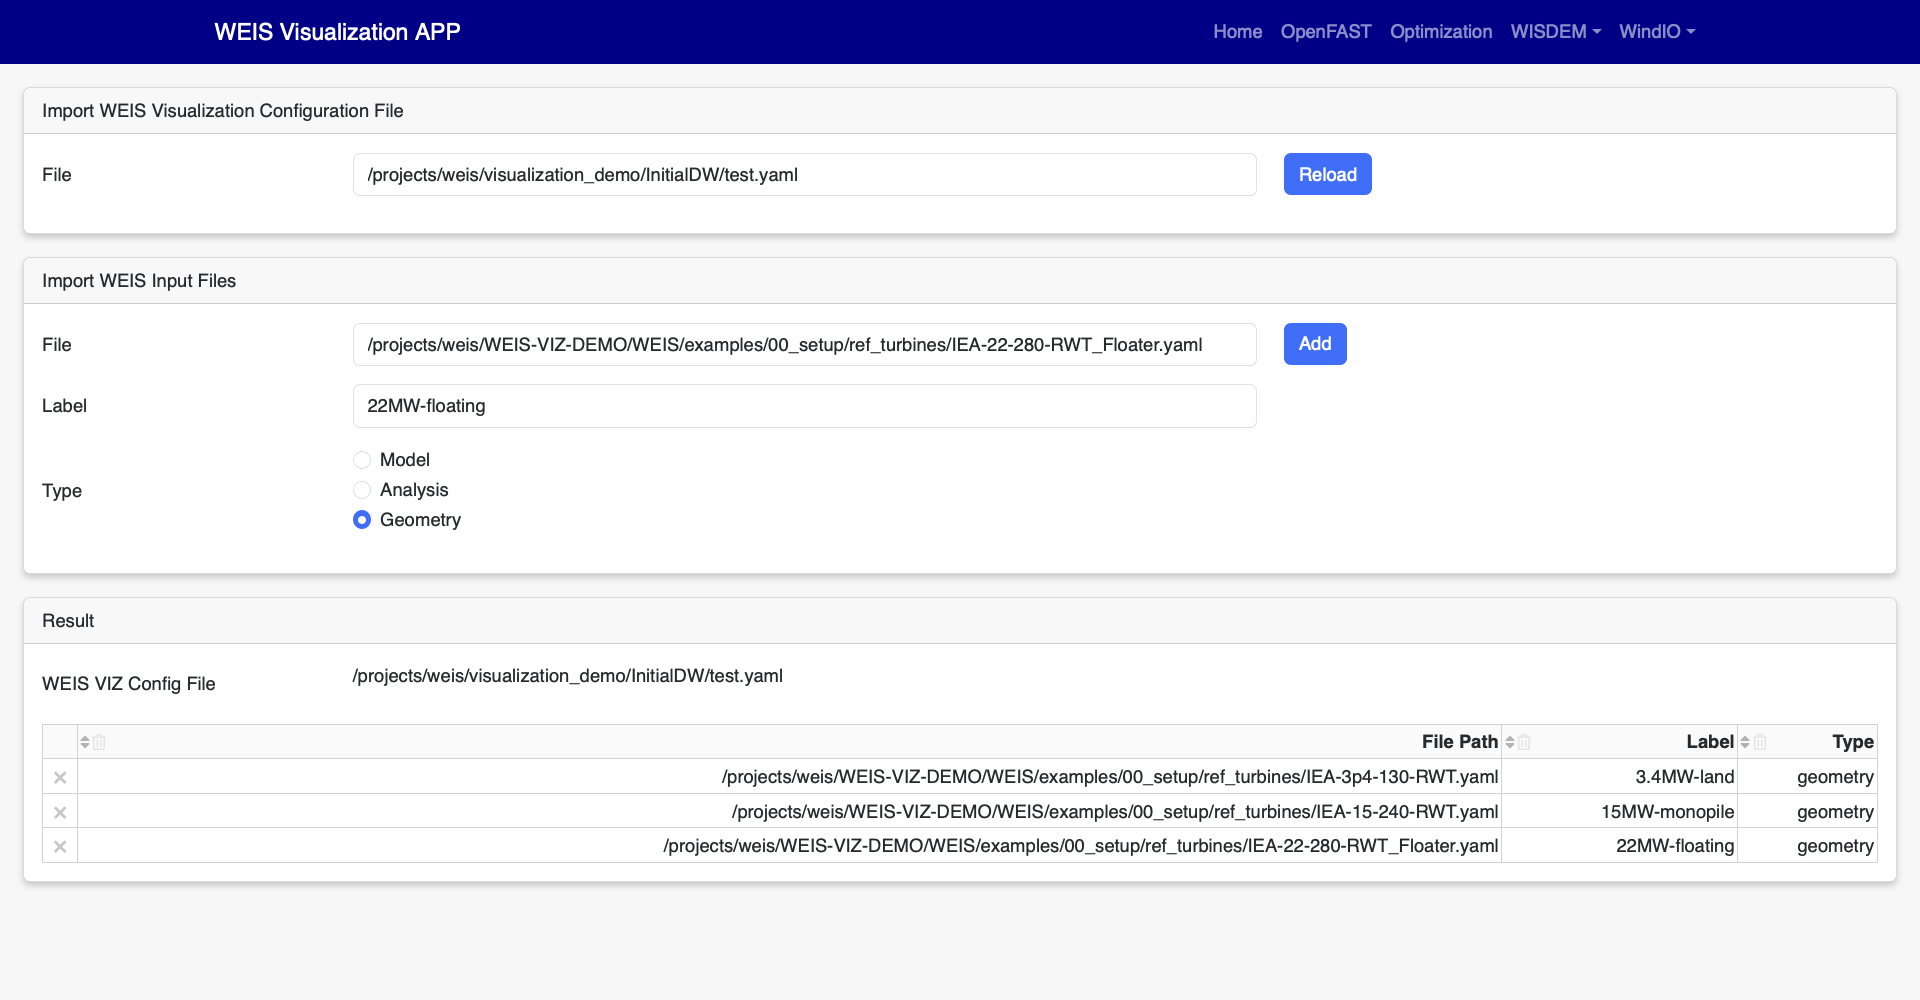
To visualize WEIS inputs files, import them on the home page.
Enter the file path, a label name, and file type and click Add button, then confirm if the file has been successfully loaded under Result table.
Three types of inputs - modeling, analysis, and geometry - exist, but we only support geometry yaml files for now. For better understanding, please refer to WEIS Inputs.
The app has been tested with three sample geometry yaml files - 3.4MW, 15MW, 22MW from examples/00_setup/ref_turbines .
3D Visualization
The Dash-VTK library is used to render 3D geometries from WindIO format. The app provides an interactive interface where users can compare multiple wind turbines with pan, rotate, zoom, etc. If user clicks a specific turbine component (blade, tower, hub, nacelle), the local-view of each component across multiple turbines is provided with detailed information.


Airfoils Properties

Blade Properties

Tower Properties

Reference
Application File Structure
visualization/
     ├── appServer/
     │        ├── app/
     │        │      ├── assets/
     │        │      ├── mainApp.py
     │        │      ├── pages/
     │        │      │     ├── home.py
     │        │      │     ├── visualize_openfast.py
     │        │      │     ├── visualize_opt.py
     │        │      │     ├── visualize_wisdem_blade.py
     │        │      │     ├── visualize_wisdem_cost.py
     │        │      │     ├── visualize_windio_3d.py
     │        │      │     ├── visualize_windio_airfoils.py
     │        │      │     ├── visualize_windio_blade.py
     │        │      │     └── visaulize_windio_tower.py
     │        │      └── tests/
     │        │              ├── test_app.py
     │        │              ├── test_3d_callbacks.py
     │        │              ├── test_airfoils_callbacks.py
     │        │              ├── test_blade_callbacks.py
     │        │              ├── test_tower_callbacks.py
     │        │              └── test_raft_opt.py
     │        │
     │        └── share/
     │            ├── auto_launch_DashApp.sh
     │            ├── sbatch_DashApp.sh
     │            └── vizFileGen.py
     ├── meshRender.py
     └── utils.py